In Mondial CRx, Column Layouts are defined to establish what type of data a column will contain, including:
-
- A header description to be displayed for columns
- Whether the column contains actual or budget data
- Whether or not the data in the column is calculated via a formula
- Whether the column is hidden
- The periodicity of the data in the column (this month, last month, last year etc.)
- Whether the column is company-specific or not
- Whether the data is more specifically filtered
- Data from the source systems
- Data from the source plus appended data from Mondial CRx processing
The column layout option is also used to determine the format of the output such as:
-
- Column justification
- Column width
- Data display (suppress zeros, number of decimal places, etc)
Building a Column Layout
The example below creates a column layout with five columns
- A description column
- The period data for the period selected at the report run time
- The YTD data for the period selected at the report run time
- The YTD data for the equivalent period in the prior year to that selected at report run time.
- A calculation of year-on-year variance
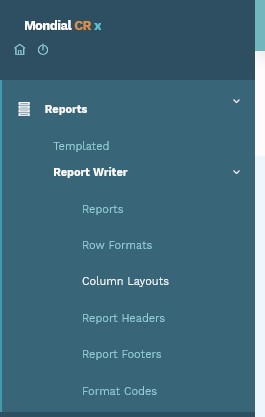
Select Column Layouts from the home screen
A list of previously defined column layouts will appear plus the option in the top right of the screen to add a new Column Layout as shown below:

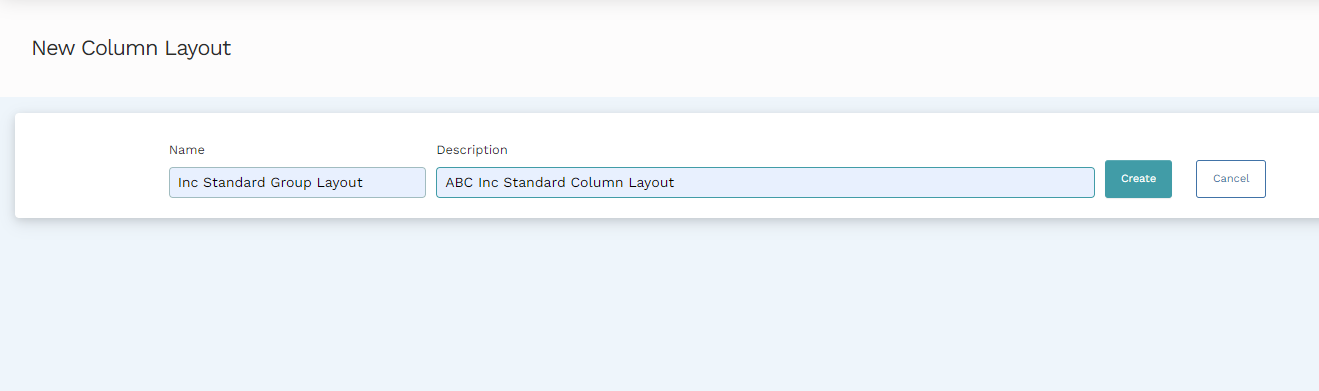
Select Add Column Layout on the top right and you will be presented with the following screen asking for a column layout name and a column layout description. Enter the relevant information herein.
Note: Ticking the Landscape box will change the PDF or Web layout to landscape
after you Generate Report
Select create and the following screen is presented showing the three sections: a column type section, a header row section, and an additional column detail section as below.

Two columns are automatically created by default since a report must logically show the description of the rows contained in the report (which will be defined later when we establish a Row Format) and at least one column of data.
Within each column, three mandatory sections need to be declared and one optional section:
Mandatory sections
- A Column Type
- Header Rows for the column
- Column Detail for the column
Optional section
- Companies (explained at the end of this article)
Mandatory sections:
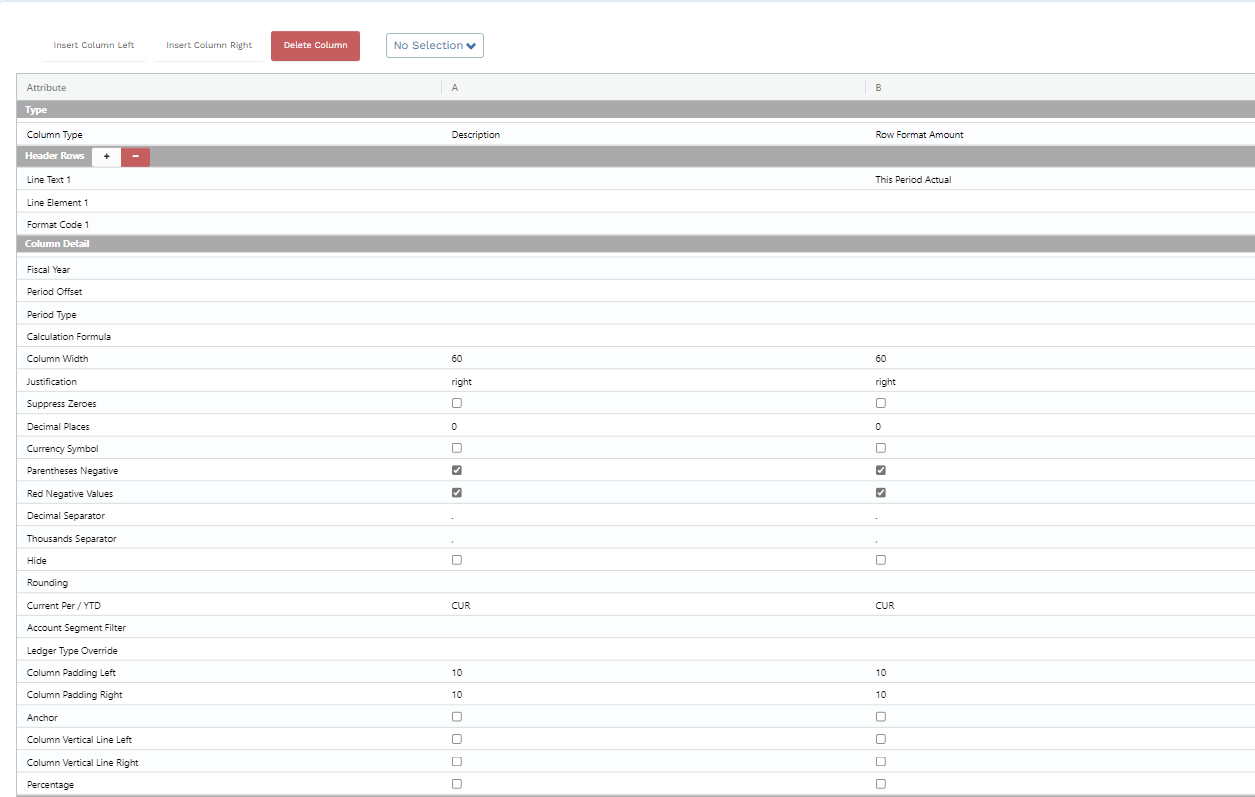
In this example, the description column can be left with all the defaults since this will typically suit most circumstances.
We can move to update column B to identify our first set of data, which in our example is Period Actual Data
Column Type
Select at the on-screen intersection of ‘B’ and Column Type and double click to reveal the options available

The following options will be presented:
| Option | Description |
| Budget Amount | The budget amount (if loaded into Mondial) for the relative run-time period. |
| Budget or Actual Amount | Data presented here will either be the budget amount or the actual row format amount in relation to what is available in the relevant run-time period. |
| Column Calculation | A calculation-based column (which will be affected by the column calculation as defined in the column detail section) |
|
Description |
A description column. In the example, the description is already set in column A, but we could choose to have this in another column if required – perhaps for a report showing the period date on the left and YTD data on the right separated by a description in the center of the report |
| Period Base Calculation | This column defines a column using a calculation based on a period base on YTD, current year, or any other user-defined period. |
| Row Format Amount | The default for Actual Data |
| Separator |
In effect a blank column, the width for which would be determined in the column detail section |
The default Row Format Amount represents Actual Data so select this.
Header Row
Select the ‘field’ at the intersection of Column B with the Line text 1

This is simply a line of text so type ‘This Period Actual’
Alternatively, to optionally add information based on a data element double click at B, Line element 1. A drop-down section will reveal some of the options which can be selected herein:
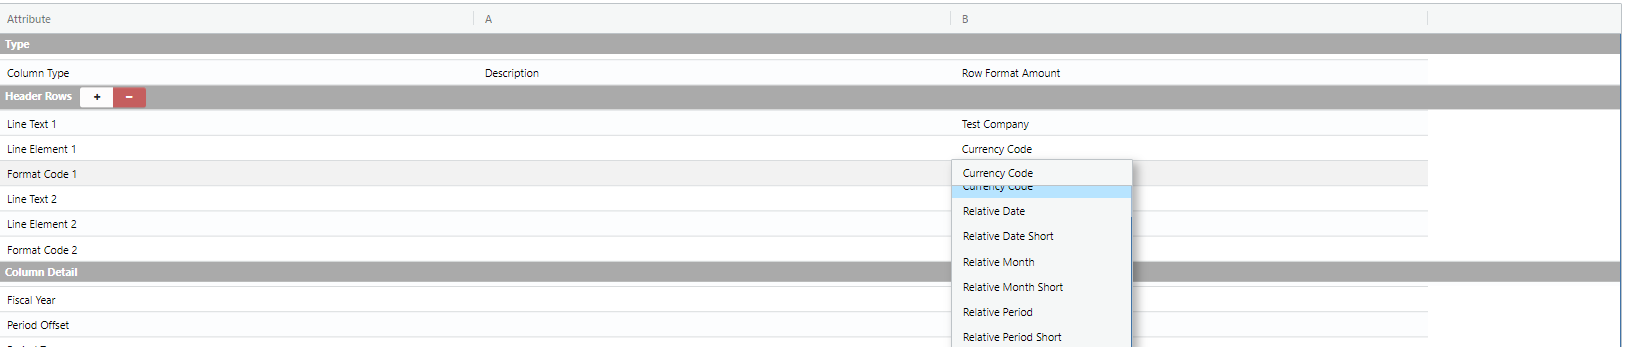
The options which are available here can be defined as:
| Option | Description | Output |
| CURRENCY_CODE | Display the currency code selected for the report run time. | $ |
| RELATIVE_DATE | Display the description of the column as the date | 31 March 2018 |
| RELATIVE_DATE_SHORT | The short version of the declared relative date. | 31/03/2018 |
| RELATIVE_MONTH | Display the description of the column as the month | March 2018 |
| RELATIVE_MONTH_SHORT | Declared as the short version of the description above. | Mar-18 |
| RELATIVE_PERIOD | Display the description of the period as already declared in Enterprise settings in Mondial | Period 3 2018 |
| RELATIVE_PERIOD_SHORT | Per above but with the declared short name for the period | Per-3 2018 |
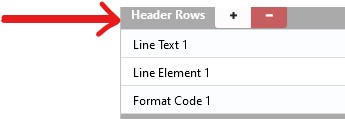
NOTE: Any single header row can contain EITHER a text line OR an Element line, but not both.
To include both in a column use the Add header row option (+,-) next to the header row and declare one row for text and one row for an element.
Column Detail
Several attributes are available for declaration in the section of the column definition:
| Option | Description |
| Fiscal year |
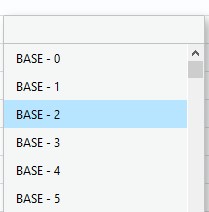
Double click and a list will appear
These are relative year addresses (relative to the year selected at run time). For example, declaring Base – 0 for this column will be the selected run time year - 0 |
| Period Offset |
This represents the relative period address (relative to the PERIOD selected at run time) Similar to the Fiscal year, declaring Base – 0 for this column, for example, will select data from the run-time PERIOD - 0 |
| Period type |
This option determines the granularity of the data required in the column. Options are:
|
| Calculation formula |
This will be used in conjunction with a column declared in the column type (see notes above) as a calculation column. As an example, a calculation stated here as B-C would subtract data in column C from data in Column B.
|
| Column Width | The width required for the column. Overtype default entry as necessary. |
| Justification | Right left or center justification. (Double click field for options). |
| Suppress zeros | Do not show zero values. (Double click and select the check box for true). |
| Decimal places | Level of decimal accuracy required. Overtype the default entry as necessary. |
| Currency symbol | Display the current symbol in front of the data (Double click and select the check box for true). |
| Parenthesis negative |
(Double click and select the check box for true). |
| Red Negative values |
(Double click and select the check box for true). |
| Decimals separator | Overtype default entry as necessary |
| Thousands separator | Overtype default entry as necessary |
| Hide | Hide the column. You may choose to do this if a column of data is required for the basis of a calculation column but does not need to be shown on the final report output. (Double click and select the check box for true). |
| Rounding | Adjust the return data into either a thousand intervals (1,000) or million intervals (1,000,000). Default is blank (no rounding) |
| Current year/YTD | Allow for a column to display current period amounts (CUR) and year-to-date (YTD) amounts. The default option is CUR. |
| Account Segment Filter |
Allows reporting in a column to be filtered by a range. Data is limited by using a combination of wild cards (the ?) and specific account codes to specify the full account code. This is useful for a location or department reporting as the example below shows where the third segment (the location segment in this example) will be filtered to only show the 10000 location. The other two segments will come from the Row Format. Account Segment filter: ??????-????-10000 |
| Ledger Type Override | Selecting a Ledger at Column level will override the selection made at report run time for this column only. For example, a user chooses US GAAP when running the report, but if a specific column has been set to IFRS, this will override US GAAP and return IFRS data for this column only. |
| Column Padding Right |
This is an additional setting providing (in addition to column width) a further, more subtle mechanism, to control the display of each column in a report. The value represents a "point" shift for the right-hand side of a column. |
| Column Padding Left | This is an additional setting providing (in addition to column width) a different, more subtle mechanism, to control the display of each column in a report. The value represents a "point" shift for the left-hand side of a column. |
|
Anchor
|
This setting is used to center a specific column for the report as a whole. Checking the box in this instance will dictate that a specific column is the center point for the report and all other columns will be "anchored" around it. NB. Only chose ONE column as an anchor column.; |
|
Column Vertical Line Left |
Inserts a vertical line to the left of the selected column. |
|
Column Vertical Line Right |
Inserts a vertical line to the right of the selected column. |
|
Percentage |
This is a formatting function only. Checking the box in this instance will add a "%" sign after each data value is returned on a row for that column. |
|
Zero to Dash |
This checkbox allows on a column by column basis, any zero value to be replaced with a dash (-) |
|
Division by Zero |
This settings allows a user to handle divide by zero/blank scenarios by replacing the system generated outputs (NaN, Div#) with a character or value of their own choosing |
|
Budget Version |
This drop down settings allows the user to override any report runtime budget selections with a specific budget for the particular column. |

Based on these options, in our example, for Column B, attributes are updated as follows
Now add a new column in the layout for the Year to Date Actual. To add a new column to the layout, Select Column B in the drop-down panel and then Insert Column Right per below:

Based on the notes above for Column Type, Header rows, and Column Detail the attributes for Column C can be amended as:
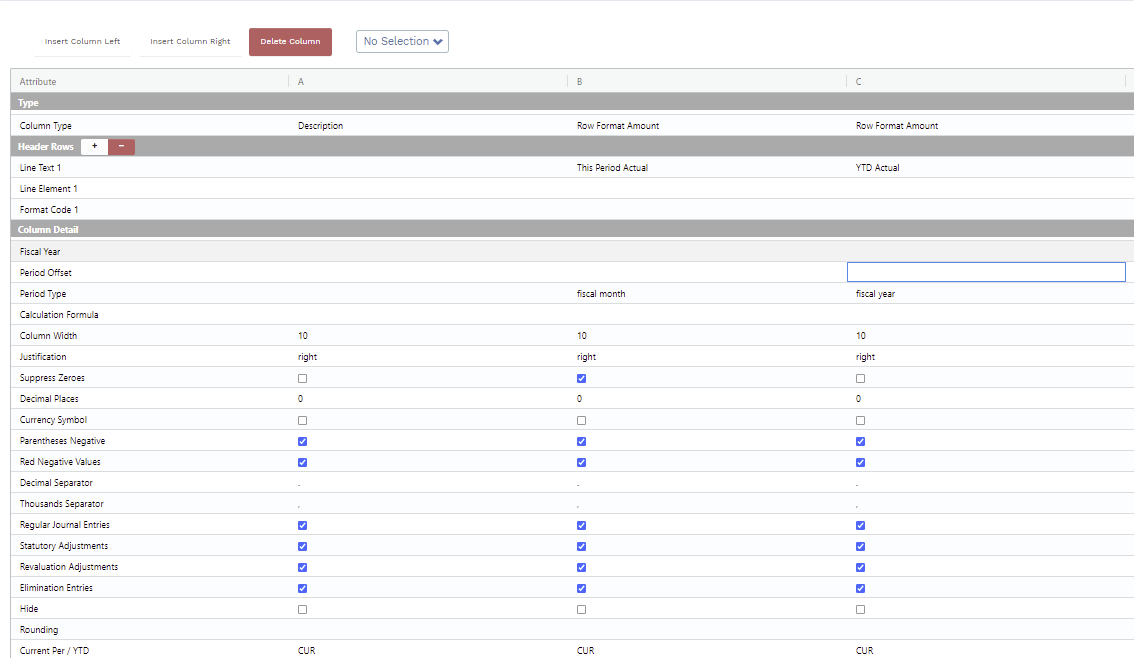
Note the key differences in Line Text 1 and Period Type
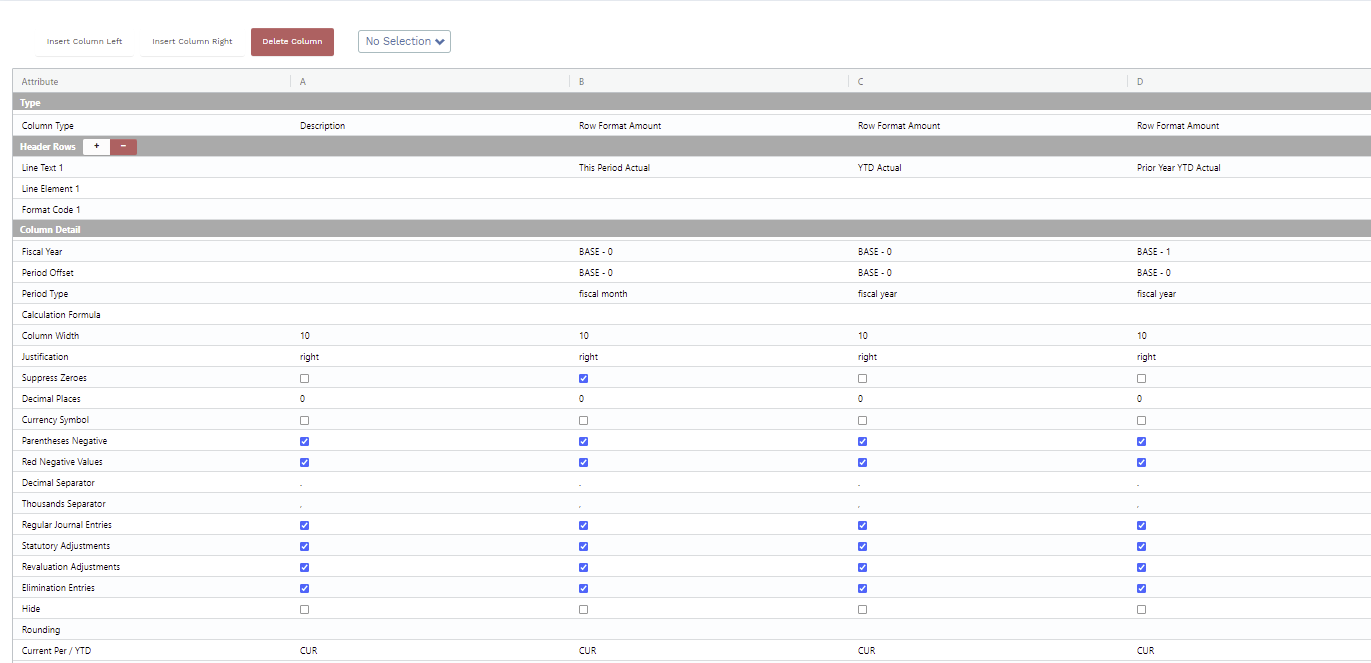
Repeat this process by adding a further column for Prior Year YTD Actual. The results should look like this:
Finally, we need to add our calculation column to the layout. Add a new column (E) as before.
However, in this column
- Change the Column Type to Column Calculation
- Add a header description (Variance Year on Year)
- Add as calculation formula expressed as C-D.
The final result for your Column Layout should now look like this
Additional Options
Further options are available to regulate the data which is returned during the report run time. The following are available:
- Transaction filters.
- Companies.
Optional Transaction Filters
The first option is transaction filters which creates the ability to choose which transactions will be used to return data in a specific column layout. Mondial Accounting Hub allows you to make some changes to source system transactions - for example, reevaluation and elimination.
When running a report, you may want to use your source system transactions only; or the transactions with Mondial generated adjustments; or a combination of the source system transaction and Mondial Accounting Hub generated transaction.
Transactions filters is an easy-to-use field that allows you to choose the transaction to use for a specific column layout by checking a box to include a specific transaction or unchecking the box to remove the transaction.
The transaction filters available include the following: source system entries, regular journal entries, statutory adjustments, reevaluation adjustments, and elimination entries.
| Source System Entries | Include only postings imported from the source ERP. (Double click and select the check box for true). |
| Regular journal entries | Include Mondial regular journal entry postings in the value returned. (Double click and select the check box for true). |
| Statutory Adjustments | Include Mondial statutory journal entry postings in the value returned. (Double click and select the check box for true). |
| Re-evaluation adjustments | Include Mondial revaluation journal entry postings in the value returned. (Double click and select the check box for true). |
| Elimination entries | Include Mondial elimination journal entry postings in the value returned. (Double click and select the check box for true). |
| Translation Adjustments | Include Mondial translation journal entry postings (CTA) in the value returned. (Double click and select the check box for true). |
When running a report, you would ideally want to capture both the source system transactions and the changes made on the Mondial accounting hub. Therefore, when creating a new column layout, all the transactions are selected by default as shown below.

Having all the transactions checked (which is the default option) means that the column will capture data from both the source system and Mondial-generated changes. Unchecking a box relative to a transaction means that transactions from the unchecked box won't be reflected. For example, unchecking the "Source System Entries" boxes above will mean that entries from the system won't appear on the column but Mondial-generate dated adjustments (the remaining options) will appear.
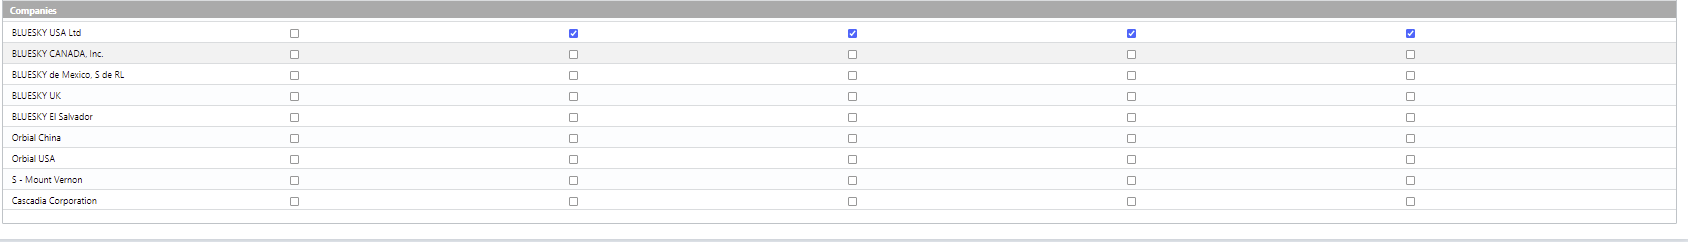
Optional Companies Section
In the Companies section of the column layout, you are presented with a list of all the companies that make up your Mondial accounting hub.
You have the option to select none, one, or many, with the following impact on your report:
| Option | Description |
| None | Leaving all the companies UNCHECKED will ensure that the data returned to the column will be for the company selected at the report run time. |
| Select one company | Choosing a single company within a given column will ensure that data for this specific company is returned to the column, regardless of the company chosen at the report run time. |
| Select multiple companies | Choosing multiple companies within a given column will ensure that data for all the selected companies are aggregated and returned to the column, regardless of the company chosen at the report run time. |
The current example uses data from Bluesky USA company only. Therefore, all the columns in this layout are checked with the exception of the first column, the Description column which isn't a data column.
Once the specific elements are defined, this Column Layout will be available for use in the Column Layout.
Drag and Drop Columns
The drag and drop feature embedded in 'Column Layouts' enables an easy and seamless arrangement of column layouts. To drag a column, right-click and hold the 'Attribute" pane of the specific Column you wish to move then drag it to the target position.

Note: Once the column has been moved, it will be renamed to fit the new position that it lands on.
For example, if 'column A' is moved to a new position between D and E, it will be renamed to Column D and the preceding columns will be rearranged and renamed to fit the alphabetic order.
Comments
0 comments
Please sign in to leave a comment.